Robust design and Optimization
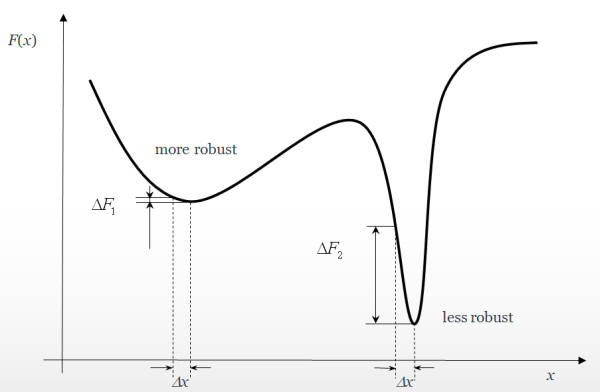
Optimal robust design is a multiobjective optimization, where the objectives are the mean (or nominal value) and the variance. A robust design is one that has minimal variance. Optimal robust design is the best of the two goal - optimality and robustness.
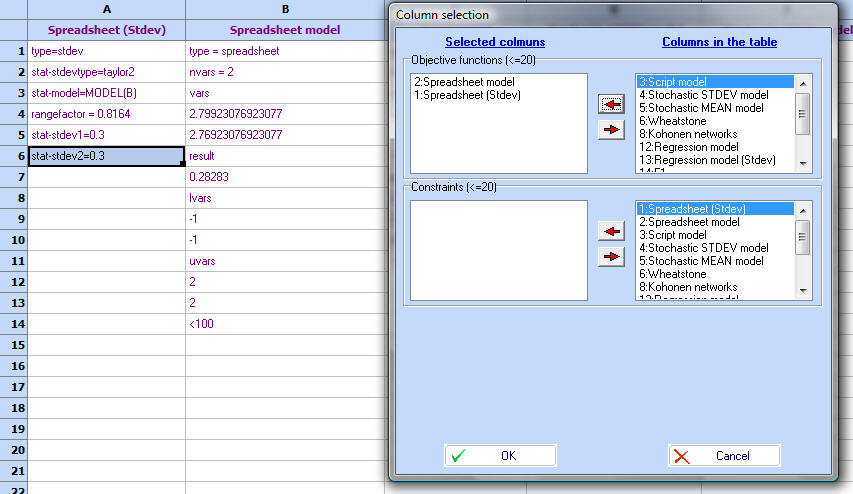
See models for more details on how to define mean and variance models. We will be using the 'Spreadsheet model' from the 'models.qsl' file to illustrate this. The optimization task is to find the maximum value of 'Spreadsheet model' with the minimum of its standard deviation.
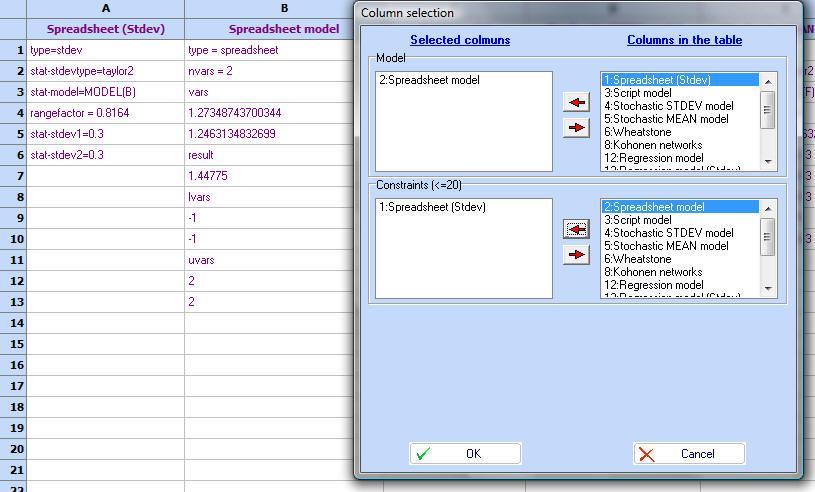
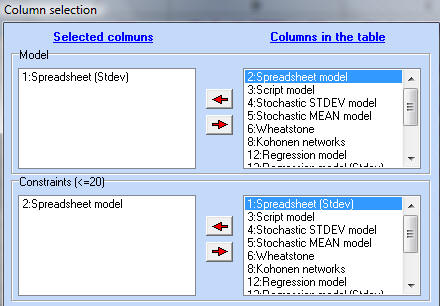
1. Let's first plot the function and its standard deviation. Choose 'Contours' and select Spreadsheet model in the Model section and Spreadsheet (Stdev) in the Constraint section. Although we are not using constraints at this stage, this will allow us to superimpose the two functions. Spreadsheet model will be the main function.
2. Click OK and the plot will be computed. Use the options on the Options2D tab to display or hide markers and contours
3. Repeat the same, by changing the main model:
4. This will allow you to produce this graph.
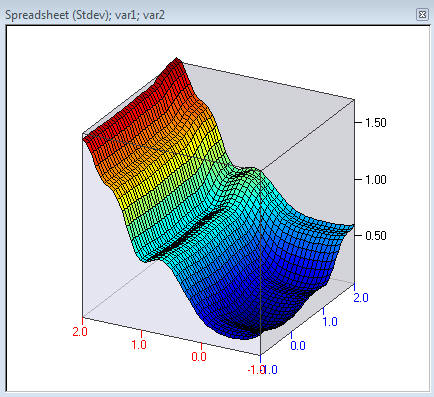
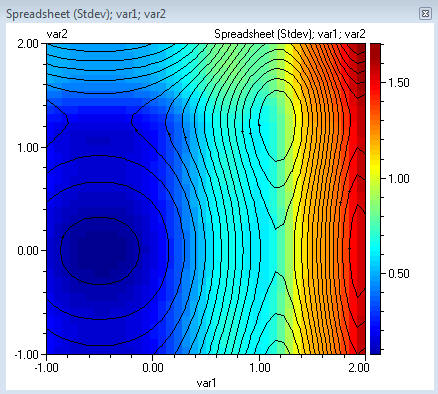
5. We can now see that the maximum of the main function does not correspond to the minimum of the standard deviation. Let's use multiobjective optimization to see the set of optimum solutions. Choose Optimization and select the two models in the Objective functions section:
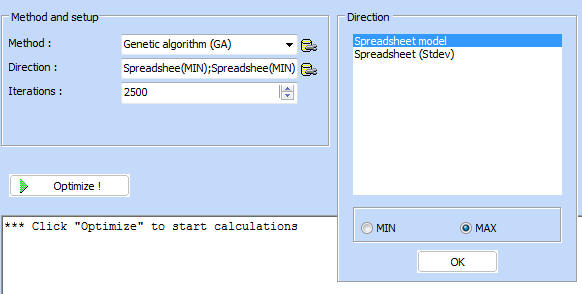
6. Click OK and the Optimization screen will appear. By default it will
minimize both function. Therefore lets choose that we want to search for maximum
on the first function. Use the Options button  ,
that is next to the Direction settings:
,
that is next to the Direction settings: 
7. Once all is selected, click "Optimize!" and wait for the process to finish. Now go to the 'Visualization TAB'. Hold CTRL and click on the plot, to set markers. These are useful to outline important points.
8. Use the popup menu (right mouse click) to select layers. They can give rough idea of the values of the function.
Looking at the Pareto front (on the right), and the corresponding values of the variables on the left can help the designer choose the most satisfactory design. For instance it becomes obvious that point 4 would be preferable to point 3, because it significantly improves the Spreadsheet model function, with only a minor increase of standard deviation. Similarly, point 5 gives very little improvement of the function but has relatively high penalty on the standard deviation. Therefore the designer most probably will choose point 4, although depending on other considerations it might be proper to choose any other point on the Pareto front.
9. The values for the markers appear on the log screen:
See also