Regression analysis
Required data
To use the "Regression analysis" tool, you need a design of experiment and the obtained from these experiments results. Each variable is stored in individual column, as well as the measured results. All columns should of type "Data" (see data types).
This is an example of data for regression analysis - 6 variables, one column with results:
General procedure
Once the input (p1 - p6 in the example above) and the output (y4) are in place, use the Charts/Regression analysis option to initiate the module. The following example is based on the data store in file 10-Regression analysis.qsl, located in the examples directory. We have chosen p1, p2, p3, p4, p5, p6 as inputs and y4 as an output.
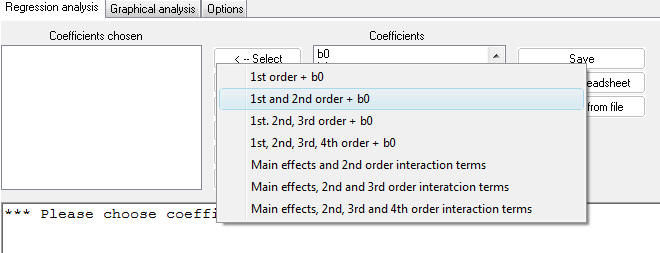
Once the module is activated, we first need to choose the structure of the model, that we would like to use for the analysis. It is possible to select the participating coefficients individually or use the predefined templates, by right-clicking the Select button, as shown in the picture below. The examples uses the 1st and 2nd order +b0 template.
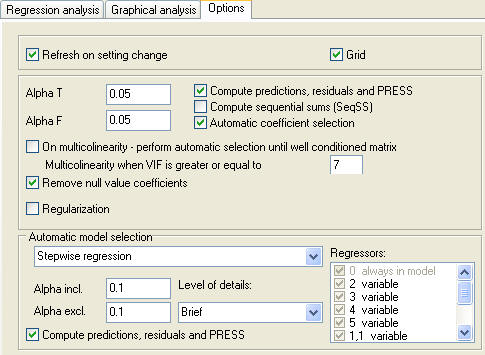
It is possible to use automated model selection procedures such as stepwise regression, forward selection or backward elimination. Should you wish to use this, select the 'Automatic coefficient selection' option, under the Options tab. You will still need to select the initial model from which the automatic procedure should start.
The model will be automatically calculated, including extensive analysis of the regression process.
Meaning of used symbols:
t - Student statistics, used for significance tests of the coefficients
![]() - critical value of the
Student statistics - significance level
- critical value of the
Student statistics - significance level ![]() and
and
![]() degrees of
freedom - two-sided test
degrees of
freedom - two-sided test
p - probability of a coefficient being insignificant
A regression coefficient is insignificant if
![]() or
or
![]()
Residual StDev -
residual standard deviationR-sq -
determination coefficient (squared value of the correlation coefficient R)Radj-sq -
Adjusted determination coefficientF -
Fisher statistics - used to test significance of the correlation coefficient![]() -
-
P -
the probability of the correlation coefficient being insignificantThe correlation coefficient is insignificant if
y -
measured response valueyp -
predicted response valuey-yp -
residualR-sq(pred) -
determination coefficient of the predictionVIF -
variance inflation factorCoefficients can be added or removed in order to obtain a model with best regression factors and high number of significant coefficients. The final model can be saved to a file which can later be used as a template with different set of data, or can be simply transferred to the spreadsheet and used further for optimization or other activities. It is also possible to display various graphical information about the analysis. Use the drop down menu at the bottom of the Graphical analysis section:
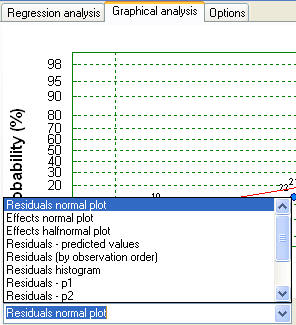
For this particular example the analysis shows that R-sq(pred) = 0 (<0), which indicates poor prediction properties of the model. One can also see that many of the regression coefficients are not significant. This is well illustrated on the normal and half-normal plots. It becomes clear that the following coefficients are insignificant and could be removed from the model: 23, 14, 22, 33, 56, 1, 34, 6, 45, 16, 13, 24, 55. We then return to the Regression analysis tab and use the Remove button to delete the above coefficients:
The newly computed model, shows significantly better properties:
Additional options