Box-Cox transformations
Box-Cox
transformations are used to transform observations with non-Gaussian
distributions to normally distributed data. This is possible for many, but not
all distributions. Let there are N non-normally distributed observations:
![]() ,
,![]() .
The
Box-Cox transformation is:
.
The
Box-Cox transformation is:
![]() for
for
![]() or
or ![]() for
for
![]()
Suppose there is a file in QstatLab with N non-normally distributed data. Anderson-Darling test can be used to check normality of data. This criterion calculates a probability p (denoted in QstatLab as AD p) and if р > 0.05 the distribution is normal. Box-Cox transformation is used if р < 0.05. There are two programs in QstatLab which can give us access to Box-Cox transformations:
·
Normality test (![]() )
)
·
Histograms (![]() )
)
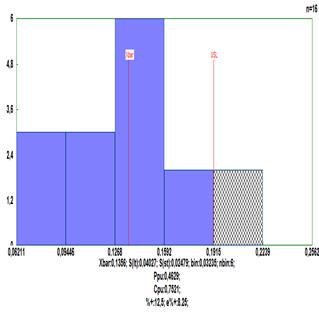
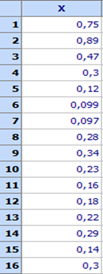
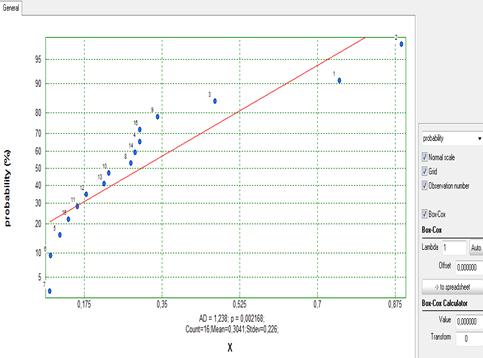
Data should be written in a column. For example let there be N = 16 observations and following upper tolerance limit is given: USL = 0,6. The histogram is shown below. The file is Normality.qsl.
This distribution is not normal. This can be shown by use of Anderson-Darling test (р = 0,002168<0,5):
Check the field before Box-Cox. One of following options can be selected:
Ø Automatic choice of λ (click „Аutо“) or manual selection by setting a value of λ through the keyboard.
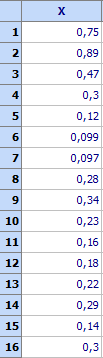
Ø Transformation of any number or data array using the selected transformation.
Ø Inverse transformation (returning to original number from a transformed value)
Ø Transfer of a transformed number or data array to a selected column of the spreadsheet or to the fields for LSL, USL or Target.
Consider the data from file Normality.qsl which are shown above and let 0,6 is written in the box for “Value”. Click “Auto” and folowing will be obtained:
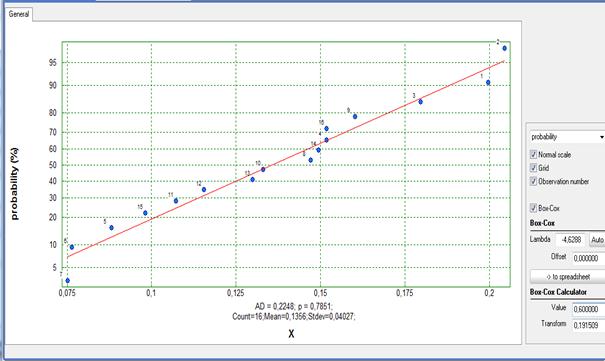
The optimal value for lambda is λ = -4,6288, and Anerson-Darling test shows р = 0,7851 for the transformed data. Therefore the tranformed data are normally distributed. After the transformation with the same λ the upper tolerance limits is USL (λ=-4,6288) = 0,191509.
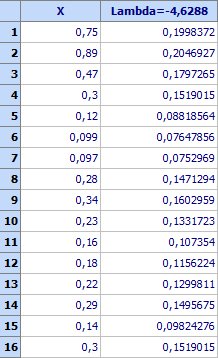
Click
![]() and
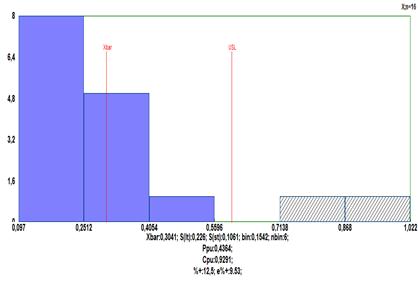
the transformed data will be sent to spreadsheed for further use. A histogram
based on this data is shown below.
and
the transformed data will be sent to spreadsheed for further use. A histogram
based on this data is shown below.
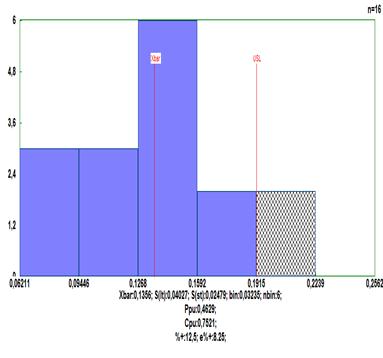
The same transformation can also be performed from the program for histograms. Select “Box-Cox transformation” and then click “Auto”. A numerical value can also be chosen (for example USL = 0,6). The transformed value will be seen in a window marked as “Transformed”. Using the key “Upper” it can be sent to the field for Upper tolerance limit. The same way can be proceeded with LSL and Target.
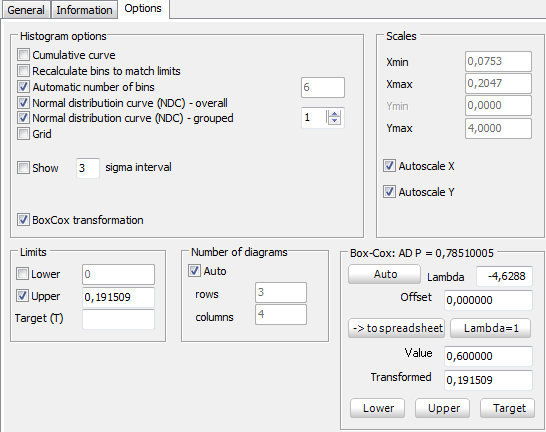
Click „General“ and a histogram with the transformed data will be seen: