Histograms
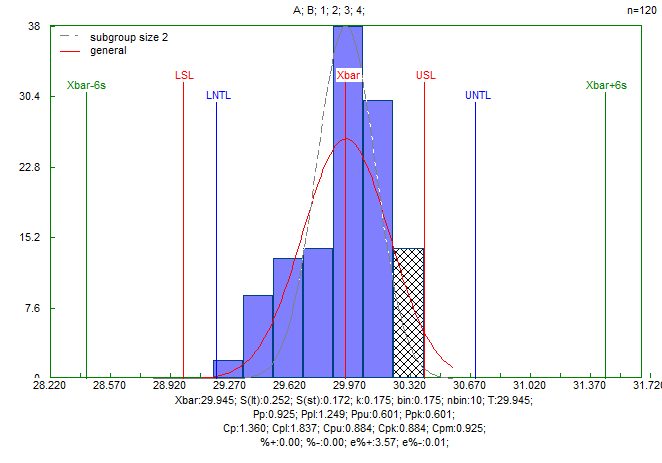
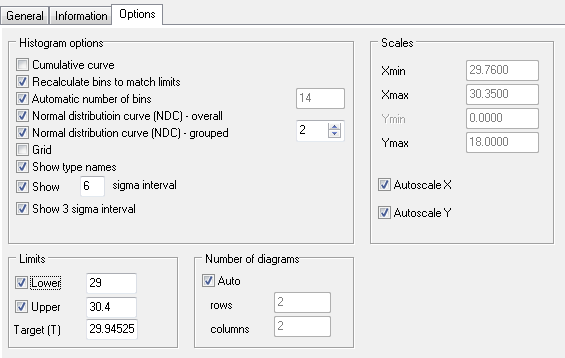
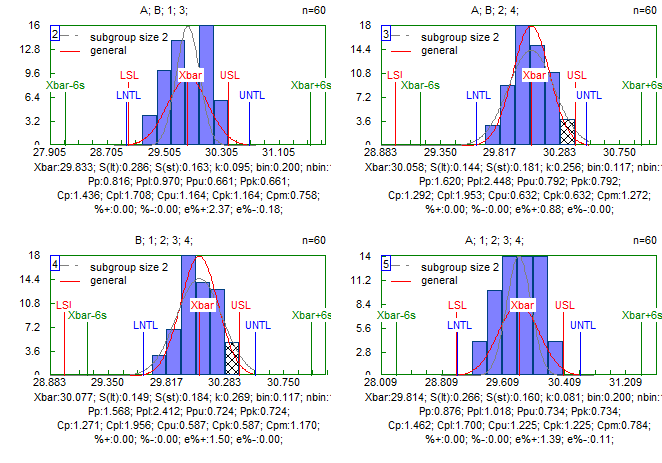
To see examples of data for Histograms, open the 3-Histograms.qsl file from the examples directory. After the data is in place, Choose the "Charts/Histograms" options. We used the "diameter" for data, and "worker", "machine" as types to produce the following graphs
General histogram

Options screen

Meanings:
Xbar - average value
S(lt) - longterm standard deviation, 
S(st) - short term standard deviation, ![]() , where
, where ![]() is the
average range in subgroups,
is the
average range in subgroups, ![]() is constant that depends on the size of the
subgroup
is constant that depends on the size of the
subgroup
k - bias coefficient, ![]() , where
, where ![]() , and USL and LSL are the upper and
lower tolerance limits
, and USL and LSL are the upper and
lower tolerance limits
![]()
![]()
![]()
![]()
 ,
where T is the target value.
![]() are based on the
short term standard deviation
are based on the
short term standard deviation
![]() are based on the
long term standard deviation
are based on the
long term standard deviation
%+ observed - % observations above USL
%- observed % observations below LSL
e%+ observed % observations above UNTL
e%- очакван % observations below LNTL
Stratification

Information screen print out:
Data count: 60
Mean: 30.0768
Standard deviation (n-1): 0.1488
Standard deviation (n):S(lt): 0.1476
Standard deviation (within):S(st): 0.1835
Number of intervals (nbins): 14
Interval width (bins): 0.1167
LNTL: 29.6303
UNTL: 30.5234
Observed % < LNTL: 0.0000% 0 ppm
Expected % < LNTL: 0.1350% 1350 ppm
Observed % > UNTL: 0.0000% 0 ppm
Expected % > UNTL: 0.1350% 1350 ppm
Observed % within NTL: 100.0000% 1000000 ppm
Expected % within NTL: 99.7300% 997300 ppm
Observed % outside NTL: 0.0000% 0 ppm
Expected % outside NTL: 0.2700% 2700 ppm
m+6s: 29.1838
m-6s: 30.9699
Observed % <m-6s: 0.0000% 0 ppm
Expected % <m-6s: 0.0000% 0 ppm
Observed % >m+6s: 0.0000% 0 ppm
Expected % >m+6s: 0.0000% 0 ppm
Observed % in (m-6s;m+6s): 100.0000% 1000000 ppm
Expected % in (m-6s;m+6s): 100.0000% 1000000 ppm
Observed % outside (m-6s;m+6s): 0.0000% 0 ppm
Expected % outside (m-6s;m+6s): 0.0000% 0 ppm
LSL: 29.0000
USL: 30.4000
Observed % < LSL: 0.0000% 0 ppm
Expected % < LSL: 0.0000% 0 ppm
Observed % > USL: 0.0000% 0 ppm
Expected % > USL: 1.4958% 14958 ppm
Observed % within SL: 100.0000% 1000000 ppm
Expected % within SL: 98.5042% 985042 ppm
Observed % outside SL: 0.0000% 0 ppm
Expected % outside SL: 1.4958% 14958 ppm
k: 0.2692
Target: 29.9453
Pp: 1.5676 Cp: 1.2715
Ppl: 2.4116 Cpl: 1.9560
Ppu: 0.7237 Cpu: 0.5870
Ppk: 0.7237 Cpk: 0.5870
Cpm: 1.1702
Standard deviation used to calculate Cp, Cpl, Cpu, Cpk, Cpm has been estimated
on the basis of Rbar (the mean of the range within the subgroups)