Model definition
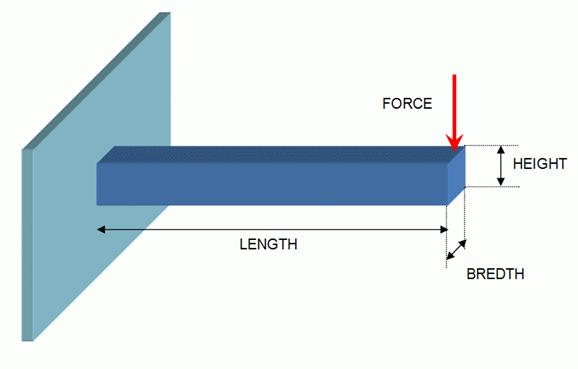
Cantilever beam
There are several ways to define a model in QstatLab. They will be demonstrated using the Cantilever beam example.
Cantilever beam
Cantilever beam
Variables:
Height - HEIGHT [5 50]
Bredth - BREDTH [20 250]
Objective 1: Minimum cross section area:
AREA = HEIGHT * BREDTH;
Objective 2: Minimum bending stress:
SIGMA-B = 6.0*FORCE*LENGTH/(BRDTH*HEIGHT*HEIGHT);
Constraints
%bending stress: SIGMA-B <= 200
CONS(1)=6.0*FORCE*LENGTH/(BRDTH*HEIGHT*HEIGHT);
%cross section stress: TAU <= 100
CONS(2)=1.5*FORCE/(BRDTH*HEIGHT);
%deflection: DEFLN <=5
CONS(3)=4.0*FORCE*LENGTH^3/(EE*BRDTH*HEIGHT^3);
%Height over bredth ratio: H-ON-B <= 10
CONS(4)=HEIGHT/BRDTH;
%Critical force: F-CRIT >=5000
CONS(5)=(4.0*sqrt(GG*(BRDTH^3*HEIGHT+HEIGHT^3 *BRDTH)*EE*(BRDTH^3*HEIGHT)/(144.0*(1.0-NU*NU)))/(LENGTH*LENGTH));
Constants
LENGTH = 1500; FORCE = 5000; FACTOR = 2; EE = 216620;
GG = 86650; NU = 0.27; SIGMAY = 200
Model definition using spreadsheet formulae
Each objective and constraint should reside in a separate column. The cell under the word ‘result’ should contain the correct spreadsheet formulae. For example – see beam\beam-spreadsheet.qsl. Click ‘Show formulae’ to see the spreadsheet formulae instead of their results.
See "Spreadsheet models" for further information.
Model definition using scripts
The following demonstration is stored in beam\beam-script.qsl. The first column, contains definition of the main model, which has type = script in its first row. The field ‘scriptfile’ contains the name of a file that contains a script. The value of this model is the value of the first element of the internal vector qs_RESULT. The rest of the columns are references to other elements of this vector. They are designated as type = intvar (internal variable). This type allows access to the results stored in qs_RESULT during the execution of the script. Therefore the script will be executed only once.
The script that is being executed is stored in the file beam.qscript and is as follows:
'script language = VBscript
function Main()
' define constant
values
LENGTH = 1500
FORCE = 5000
FACTOR = 2
EE = 216620
GG = 86650
NU = 0.27
SIGMAY = 200
' use the internal
array qs_VARS, which is populated before each function evaluation
BRDTH = qs_VARS(1)
HEIGHT = qs_VARS(2)
‘ calculate objectives and
constraints
AREA = BRDTH*HEIGHT
SIGMAB = 6.0*FORCE*LENGTH/(BRDTH*HEIGHT*HEIGHT)
TAU = 1.5*FORCE/(BRDTH*HEIGHT)
DEFLN =
4*FORCE*LENGTH*LENGTH*LENGTH/(EE*BRDTH*HEIGHT*HEIGHT*HEIGHT)
FCRIT =
(4*qs_sqrt(GG*(BRDTH*BRDTH*BRDTH*HEIGHT+HEIGHT*HEIGHT*HEIGHT*BRDTH)*EE*(BRDTH*BRDTH*BRDTH*HEIGHT)/(144*(1-NU*NU)))/(LENGTH*LENGTH))
HONB = HEIGHT/BRDTH
' store results in qs_RESULT
qs_RESULT(1) = AREA
qs_RESULT(2) = SIGMAB
qs_RESULT(3) = DEFLN
qs_RESULT(4) = TAU
qs_RESULT(5) = FCRIT
qs_RESULT(6) = HONB
end function
By definition, all variable beginning with qs_ are internal variables or functions defined by QstatLab. The script is being executed once on each function evaluation. Before its execution, current values of the variables are stored in qs_VARS. qs_NVARS contains the number of variables (which is also specified in the nvars field in the spreadsheet model definition). These values can be used to compute the objectives and constraints and then store them in qs_RESULT. When the script completes, QstatLab will use the values in qs_RESULT.
See ‘Scripts’ for further details on internal variables and functions.
Using external executables as models in QstatLab.
Scripts present convenient opportunity to execute an external executable during runtime. Therefore the user can write the appropriate script that will act as an interface between the external executable and QstatLab. The usefulness of this feature comes from the ability to launch commercial or user written programs that are originally designed to work in standalone mode. A good example for instance are the finite element packages such as Fluent, Ansys, ABAQUS that produce a solution upon given input. However the external work flow could be as complex as the users wishes it to be and may involve a series of external executables. Communication between the external program and QstatLab is carried out using files and the internal variables such as qs_VARS and qs_RESULT. Executables are being launched using system calls, which have universal flexibility in their nature
The basic course of logic is as follows:
1. Acquire values of input variables. If the model is being used for optimization, they are stored in qs_VARS. It is also possible to read them directly from the spreadsheet using qs_CELLSTR function.
2. Create and write these values into a file that will be passed to your external executable. The easiest format is the ASCII file, but it could be any thing that suits your executable.
3. Execute the external program so that it reads the values of the variables from the input file created above.
4. At the end of its execution, the external program should be able to write the results into an output file.
5. Using script commands, read the results from the output file and store them in qs_RESULT. It is also possible to write them directly to the spreadsheet using function qs_CELLSTR.
For the purpose of demonstration we have compiled the cantilever beam script into a standalone executable, which takes an input file with two variables and produces an output file:
c:\QstatLab\ENG5\examples\beam>beam beaminp.txt beamout.txt
The input file is in ASCII format and its content is explained as follows:
|
Line |
Value |
Explanation |
|
1 |
2 |
Number of variables |
|
2 |
1 |
Value of variable 1 |
|
3 |
2 |
Value of variable 2 |
The output file is also in ASCII format with the following contents
|
Line |
Value |
Explanation |
|
1 |
6 |
Number of outputs |
|
2 |
2 |
Output 1 - AREA |
|
3 |
11250000 |
Output 2 – SIGMA_B |
|
4 |
38950697,0732158 |
Output 3 – TAU |
|
5 |
3750 |
Output 4 - DEFLN |
|
6 |
0,0942717336368761 |
Output 5 - FCRIT |
|
7 |
2 |
Output 6 - HONB |
|
8 |
2 |
Number of input variables |
|
9 |
1 |
Variable 1 |
|
10 |
2 |
Variable 2 |
First we shall demonstrate an example where the external program is not being used for optimization or contour plots.
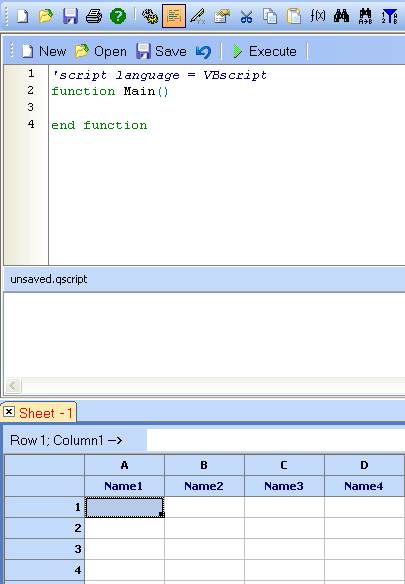
Open new spreadsheet in QstatLab and activate the Script Editor (Edit/Script Editor)
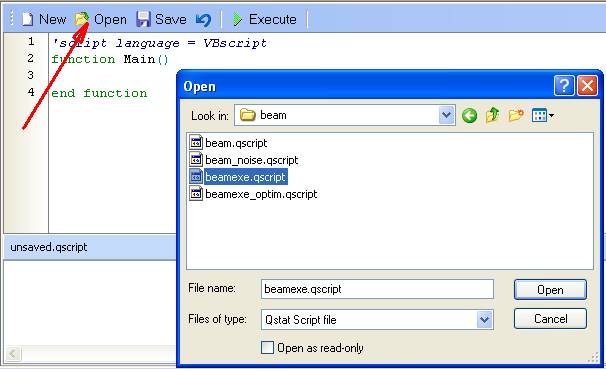
Use the ‘Open’ button in the script editor to load a script – beamexe.qscript
This script contains 2 functions – Main and beamexe. Let us first discuss function Main. It will be called by QstatLab everytime the script is executed. This particular Main function is designed to read the variables values directly from the spreadsheet, then evaluate the result using function beamexe and then store the result back into the spreadsheet.
Note! Before executing the script, you should enter some values in the column A, so that the script could read them. This will be demonstrated later.
function Main()
' declare arrays x
and y
Dim x(3), y
' read variable
values from the spreadsheet (column 1) and convert them to Double
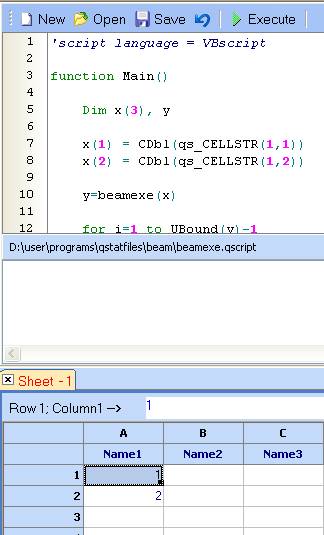
x(1) = CDbl(qs_CELLSTR(1,1))
x(2) = CDbl(qs_CELLSTR(1,2))
' Compute the
result
y = beamexe(x)
' Store the result
back to the spreadsheet (column 2).
for i=1 to UBound(y)-1
qs_CELLSTR(2,i) = CStr(y(i))
next
end function
The second functon beamexe, computes the result by calling the external executable beam.exe which has the following syntax
c:\QstatLab\ENG5\examples\beam>beam beaminp.txt beamout.txt
function beamexe(x)
' Specify filenames
exefilename =
"beam.exe"
infilename = "beaminp.txt"
outfilename = "beamout.txt"
' create object objFSO of type Scripting.FileSystemObject
' it is used for all file system and OS operations
Set objFSO = CreateObject("Scripting.FileSystemObject")
' delete input and output files if they exist.
if
objFSO.FileExists(outfilename) then objFSO.DeleteFile(outfilename)
if objFSO.FileExists(infilename) then
objFSO.DeleteFile(infilename)
' Create input file and write the number of variables and their values
Set infile =
objFSO.CreateTextFile(infilename,TRUE)
infile.WriteLine(UBound(x)-1) ‘ Write number of variables
for i = 1 to UBound(x)-1
infile.WriteLine(x(i)) ‘ Write variables values
qs_print x(i)
next
infile.Close
' Execute the external program and wait for it to finish.
Set objApp =
createObject("WScript.Shell")
objApp.Run exefilename & " " & infilename
& " " & outfilename, 2, TRUE
' Read and parse the output file and return it as a result of this function
Set outfile =
objFSO.OpenTextFile(outfilename,1)
beamexe = Split(outfile.ReadAll,vbNewLine)
outfile.close
' Delete created objects
set
objApp = nothing
set objFSO = nothing
end function
Enter two positive values in Column A (first and second row):
Click ‘Execute’
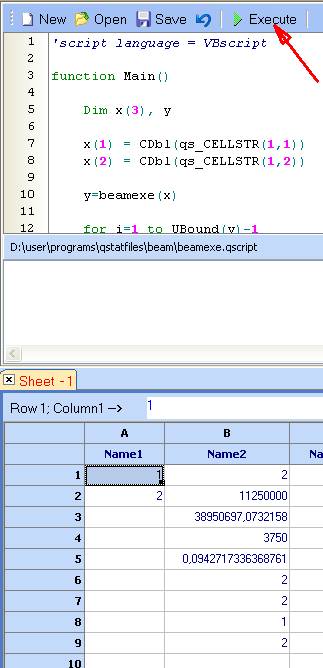
The result will be store in column 2 (column B) as specified in the script:
qs_CELLSTR(2,i) = CStr(y(i))
Should we need to use this executable as part of an optimization, we should make the following changes to function Main, so that it reads and writes to internal variables (qs_VARS and qs_RESULT) instead to the spreadsheet.
function Main()
' declare arrays x
and y
Dim x(3), y
' read variable
values from the internal array – qs_VARS
x(1) = qs_VARS(1)
x(2) = qs_VARS(2)
' compute the
result
y = beamexe(x)
' store it to
qs_RESULT.
for i=1 to UBound(y)-1
qs_RESULT(i) = y(i)
next
end function
To use this interface in an optimization, define the model as follows: (see file beam-exe.qsl).
See also:
Tutorial on model definition, optimization and robust design