Pareto diagrams
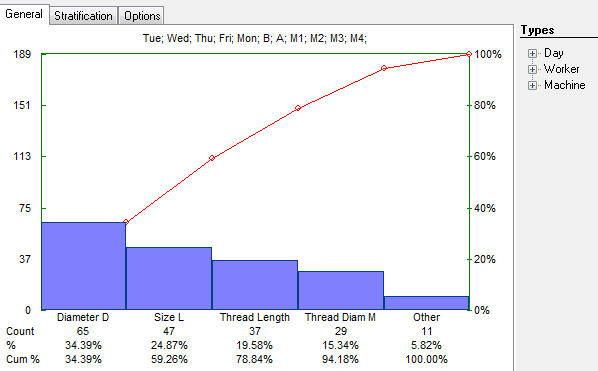
This type of diagrams is used to visualise the degree of contribution of various production defects to the total number of defects. The snapshot is from the file 2-Pareto.qsl, which can be found in the examples directory.
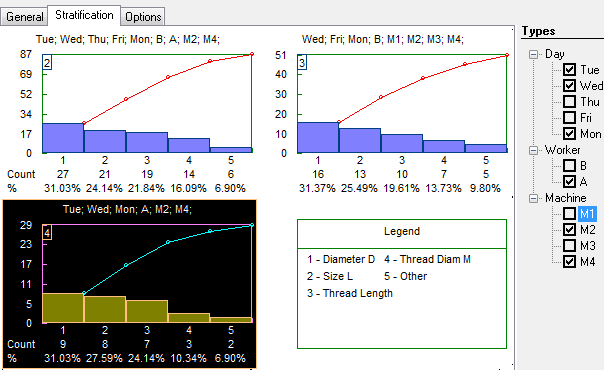
Two or more defect columns are required. They have to be marked as 'defect' in the Column property (F5) dialog. (see data types). The columns that have the word 'other' on their name will be totalled in 'Other' category of the Pareto diagram. As most of the tools in QstatLab, Pareto diagrams can be used in conjunction with one or more 'type' columns that can be used for stratification.
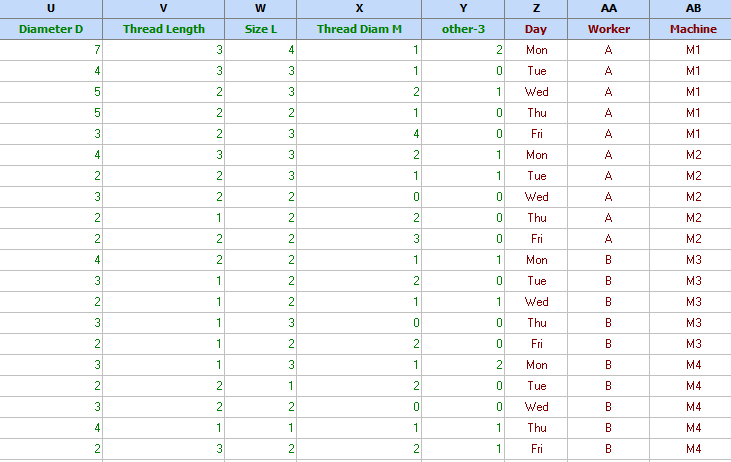
General diagram - once the data is entered, use the Charts/Pareto diagrams options, choose Diameter D, Thread Length, Size L, Thread Diam M and other-3 to be defects and Day, Worker, Machine - in the type list box.
Stratification