Time series
In some problems defects causes can be detected if the process is considered in time.
Example Consider a welding process. It is supposed that the strength of weld depends on the voltage drop during twenty four hour period. The voltage is measured every 5 minutes and data is recorded in the order of measuring. For each voltage U strength Y of weld tear is measured. 122 data are recorded. Part of them are shown below
Fragment of data for voltage and strength recorded in the order of measuring
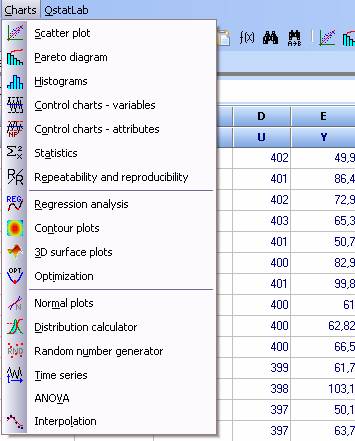
The program for time series analysis is activated by the icon or from the menu “Charts”. After column selection click OK and time series will appear on the screen. Figure below shows time series for voltage and strength. By comparing them we observe that the weld strength decreases with the growth of voltage. This can probably be explained with increasing oxidation for higher voltage processes.
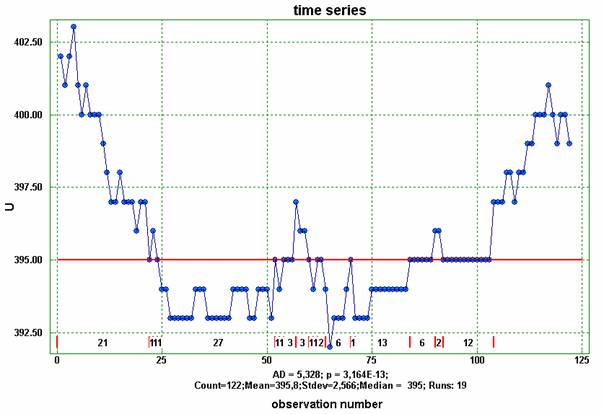
Time series for voltage drop
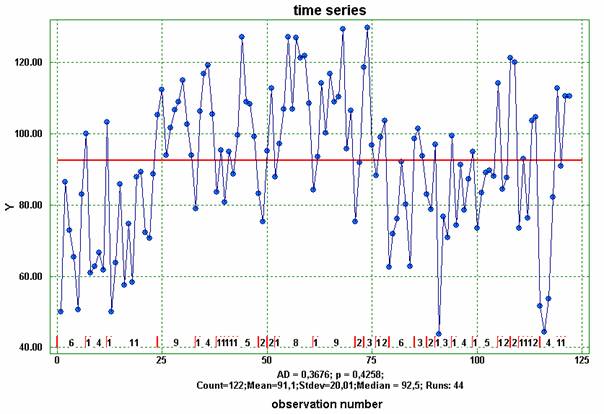
Time series for strength of weld tear
Following information is seen below the plots:
AD – Anderson-Darling parameter for testing normality of observations. The smaller AD the closer is distribution to normal.
p – Probability the observations to be normally distributed. If p is reasonably large (say p > 0.1) we can assume normal distribution of the observations. One can see that the voltage is not normally distributed, while the strength is.
Number – number of observations
Mean – mean value of observations
Stdev – standard deviation of observations
Median – median of observations. The horizontal line through the cloud of observations corresponds to their median
Runs – number of runs. Run is called a sequence of observations that are on one side of the median.
The numbers above the horizontal axis of the plot show the number of observations in corresponding runs. Looking at the time series of the voltage we can see that the first run has 21 observations, followed by three runs with 1 observation each, the next run has 27 observations, etc.
The marks on the plots can be chosen by the operator one by one to get a clearer picture. A menu for this choice is shown in the right bottom corner of the figure below.
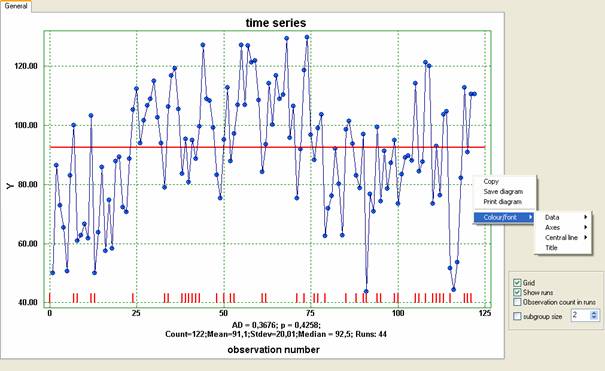
Time series for strength of weld tear with labels for runs
Note that the observations can be arranged in groups with different number of observations. When the option “subgroup size” is not marked, then the observations will not be grouped. The figure above shows other form of the time series for strength of the weld tear where the number of observations in runs is not given, but the runs are more clearly labelled.
Time series can be plotted also if the observations are grouped. The following figure shows the same data as above but this time the data are taken in groups of 5 observations.
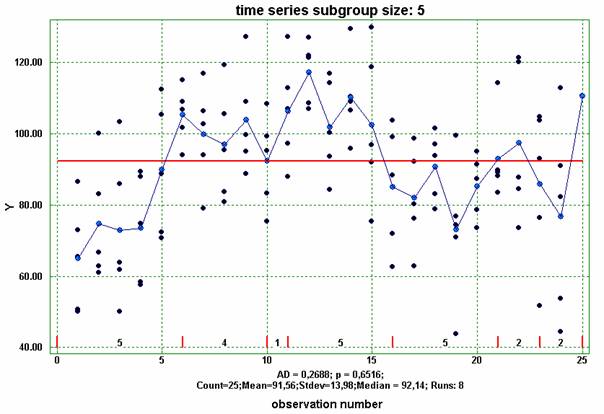
Time series with observations in groups of 5 data