Scatter plots
Enter at least two columns of data and then use the "Charts/Scatter plot" tool. "Type" column is optional. The tool will plot with or without stratification, depending on the wish of the designer.
We used the 4-Scatter plots.qsl, located in the examples directory to produce the following images:
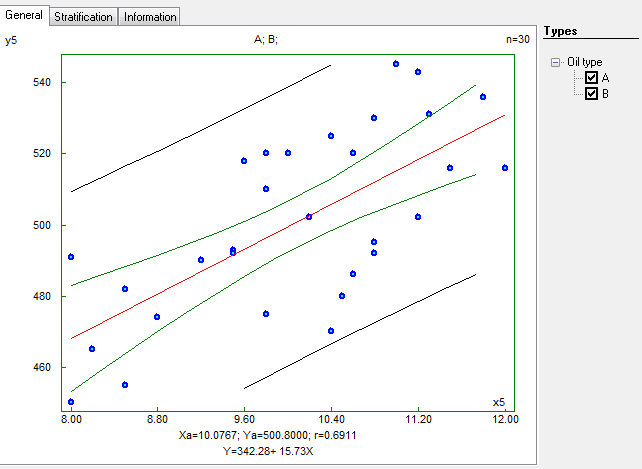
General diagram with confidence and prediction bands
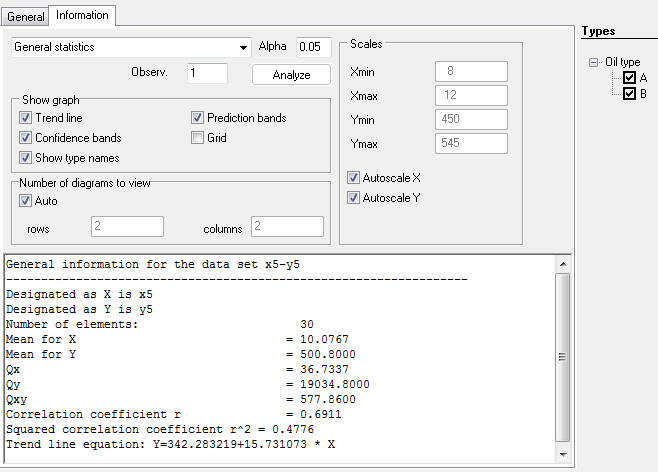
Basic statistics
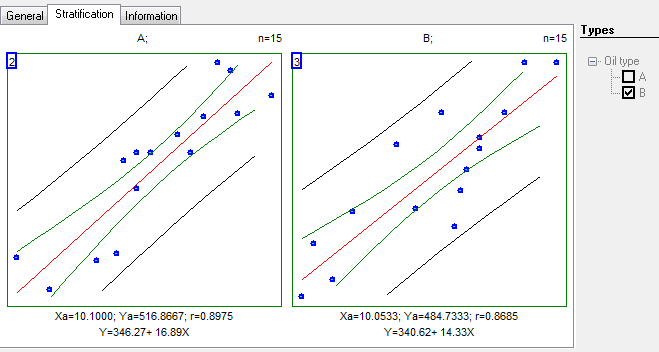
Using the 'type' parameter for stratification: