Distribution calculator
QSTATLAB
makes it possible to find critical points of following frequently used
statistical distributions: standard normal distribution, Student’s distribution (t – distribution), ![]() - distribution and Fisher’s distribution (F – distribution).
- distribution and Fisher’s distribution (F – distribution).
The
option Distribution
calculator can be selected by use of the menu “Charts” or icon ![]() . A menu
for selection of distribution appears (Fig. 13.20).
. A menu
for selection of distribution appears (Fig. 13.20).
· Standard normal distribution. This program calculates the integral
 .
.
where ![]() is normally distributed random
variable with mean
is normally distributed random
variable with mean ![]() and standard
deviation
and standard
deviation![]() ,
while
,
while ![]() is
the normalized variable
is
the normalized variable
![]() .
.
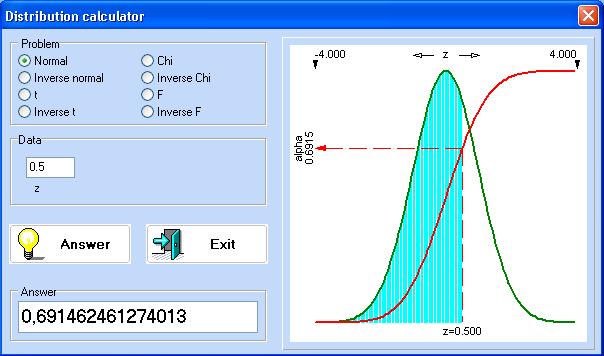
There are two
options: Normal and Inverse normal distributions. When the option Normal is chosen in
the window “Data” should be entered ![]() . Then
on the vertical axis we can read the value of alpha,
which is equal to the value of
. Then
on the vertical axis we can read the value of alpha,
which is equal to the value of![]() . It
shows the probability of occurrence of the random variable
. It
shows the probability of occurrence of the random variable ![]() to the left of some given value
to the left of some given value![]() .
.
Using the standard
normal distribution we can find the probability of occurrence of a normally
distributed random variable in a given interval![]() . It is calculated as follows:
. It is calculated as follows:
![]() .
.
Example Let us find the
probability of occurrence of a normally distributed random variable in the
interval ![]() ,
provided that its mean is m = 3
and the standard deviation is
,
provided that its mean is m = 3
and the standard deviation is ![]() . First we calculate:
. First we calculate:
![]() and
and![]() .
.
Click
“Normal”. In
the window “Data”
of the calculator put ![]() and
click “Answer”. In the field “Answer” appears
and
click “Answer”. In the field “Answer” appears ![]() =
0.158655253931457. Similarly we can find
=
0.158655253931457. Similarly we can find
![]() =
0.308537538725987. After some rounding
we calculate the probability for occurrence of
=
0.308537538725987. After some rounding
we calculate the probability for occurrence of ![]() in the interval
in the interval ![]() :
:
![]() .
.
The option “Inverse
normal”
is used to find which value of ![]() corresponds
to given value of
corresponds
to given value of ![]() .
For example let
.
For example let ![]() =
0.158655253931457. Enter this value in the window
“Data”. Click “Answer” and obtain
=
0.158655253931457. Enter this value in the window
“Data”. Click “Answer” and obtain ![]() .
.
- Student’s distribution (t – distribution)
Option “Inverse t”. Two values should be entered for this option: significance level (alpha) and degrees of freedom (ni). Click “Answer” to obtain the critical value of Student’s distribution for these parameters.
Example Let alpha = 0.05 and ni = 7. Following critical value of t-distribution can be read in the field “Answer”: 1.89457860509001.
Option “t”. In this case for a given critical value of t-distribution and given degrees of freedom look for the level of significance in the field “Answer”.
Example Let t = 1.833 and ni = 9. Click answer to obtain alpha = 0.0500089700252915.
 -
distribution
-
distribution
Option “Inverse
Chi”. Two
values should be entered for this option: significance
level (alpha) and
degrees of freedom (ni). Click
“Answer” to obtain the critical value of ![]() - distribution for these parameters.
- distribution for these parameters.
Example Let alpha = 0.05 and
ni = 15. Click “Answer” to obtain the critical value
of ![]() - distribution: 24.9957901397286.
- distribution: 24.9957901397286.
Option “Chi”. For
given critical value of ![]() -
distribution and degrees of freedom ni
click “Answer” to obtain the significance level alpha.
-
distribution and degrees of freedom ni
click “Answer” to obtain the significance level alpha.
Example Let ![]() =
10.283 and ni = 21. Click
“Answer” to obtain alpha =
0.974998498319471.
=
10.283 and ni = 21. Click
“Answer” to obtain alpha =
0.974998498319471. ![]() =
10.283 is the value above which the area under the
distribution curve is equal to alpha.
=
10.283 is the value above which the area under the
distribution curve is equal to alpha.
- Distribution of Fisher (F – distribution)
Option “Inverse F”. Three values should be entered: significance level (alpha), degrees of freedom for numerator (ni1) and degrees of freedom for denominator (ni2). Click “Answer” to obtain the critical value of F – distribution corresponding to these parameters.
Example Let alpha = 0.05, ni1 = 5, ni2 = 14. Click “Answer” to obtain the critical value of F – distribution: 2.9582489131222.
Option “F”. В For given critical value of F – distribution and degrees of freedom click “Answer” to obtain the significance level alpha
Example Let F = 5.4967, ni1 = 4, ni2 = 17. Click “Answer” to obtain alpha = 0.00499995529867125.