Control charts - attributes
Included control charts:
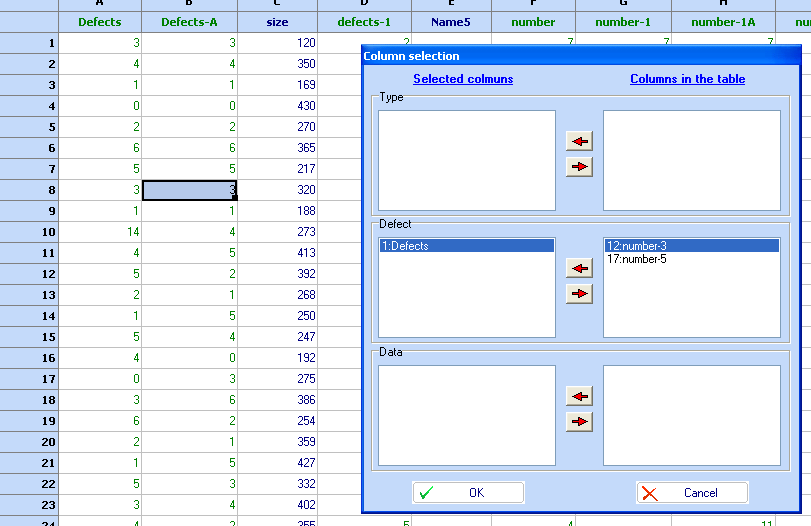
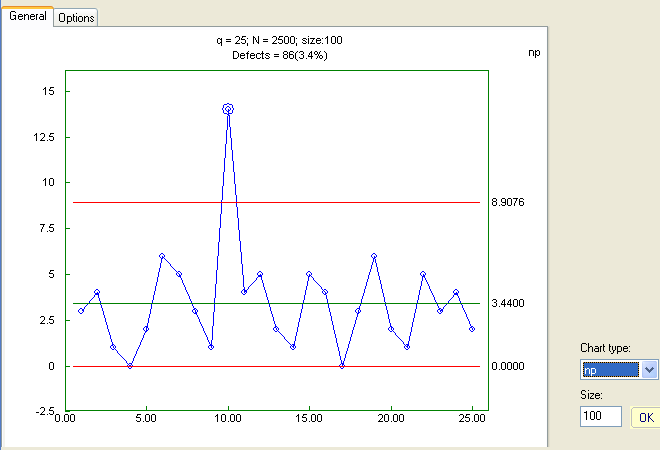
The sample size for calculation of the statistics can be varied or specified as subgroups. Let's demonstrate it on a np-chart for defects found in bolts with a constant subgroup size of 100. We have used column "Defects" (column A) in file 6-Control charts - attributes.qsl. Go to Charts/Control charts - Attributes and select 1: Defects in the Defects section

Once the chart is shown, change its type to 'np', enter 100 in the 'Size' field and click OK. You should see the following:
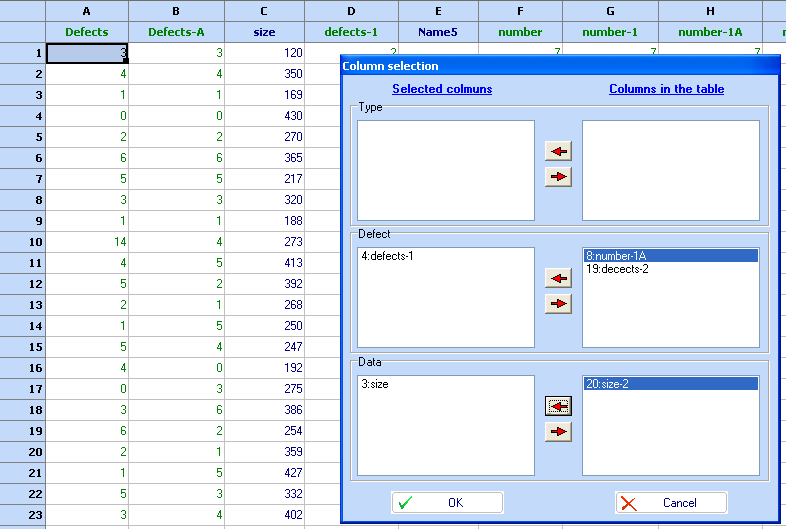
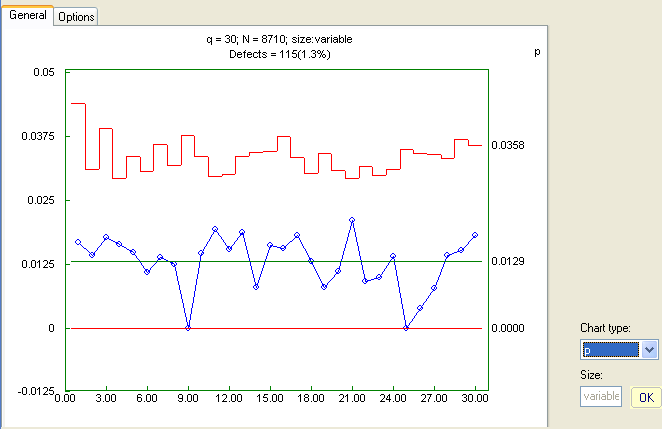
If we have variable subgroup size, which is entered into a column in the spreadsheet, we could use it to build a control chart with variable control limits:
Then the corresponding 'p-chart' looks like this:
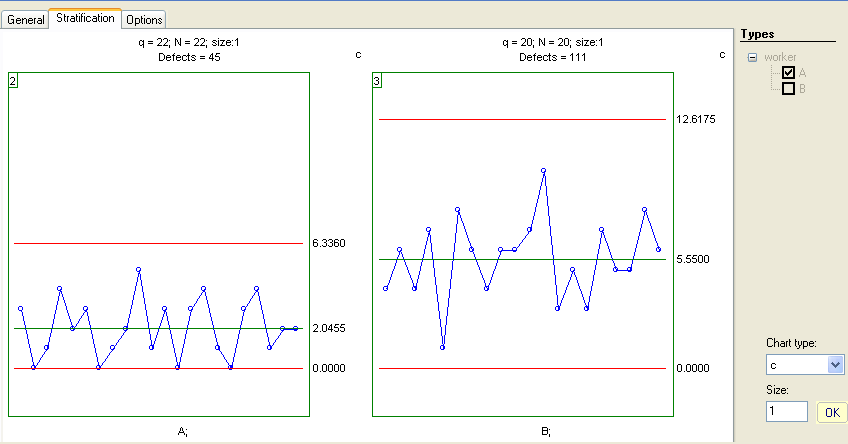
As usual, we can combine any data column with a type column to perform stratification. It is also possible to fix the scale on all stratified charts if we need to compare them.
For instance using "worker" and "number-2", and the following settings
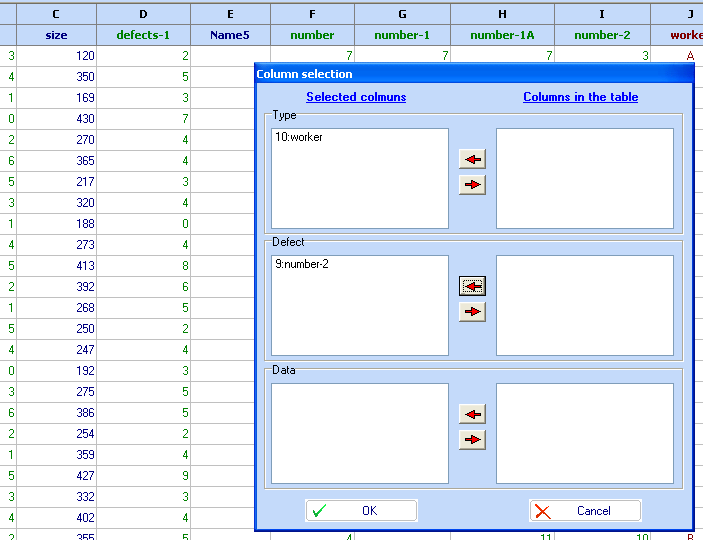
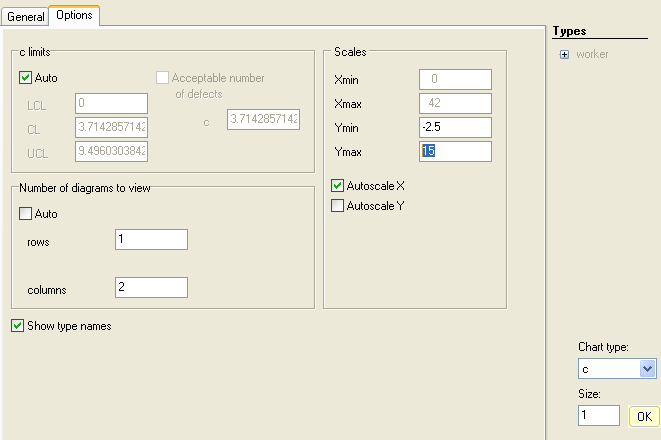
results in this:
To plot a 'u-chart' for the number of defects in 14 rolls of textile with variables size choose the following columns:
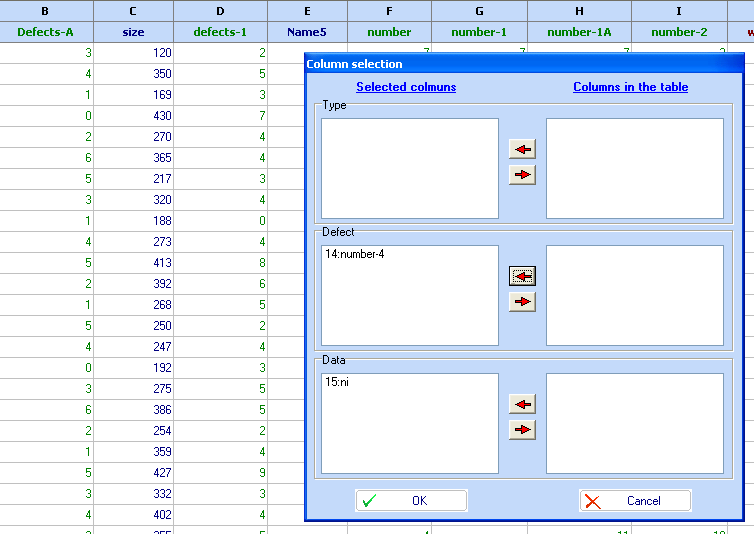
and change the chart type to 'u'. The result is shown below
