Basic statistics
This module allows performing basic statistical analysis of one or two populations of data. The analysis can produce individual statistics, as well as cross-combined statistics for the two populations
Required data:
Optional data:
The following example uses the data in file: 8-Basic statistics.qsl, located in the examples directory
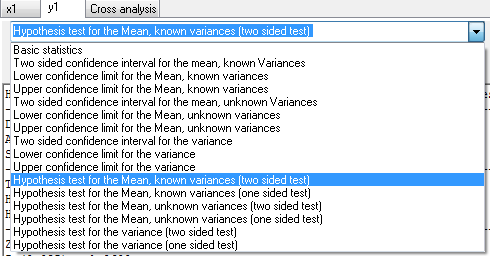
Use the "Charts/Basic statistics" option to initiate this module. Choose 'x1' and click OK; Answer 'yes' and choose 'y1'
Hypothesis test on the mean values,
Variance = 17.2436 (two sided test)
------------------------------------------------------------------------------
Degrees of freedom : 12.0000
Average: 26.9231
Standard deviation s : 4.1525
------------------------------------------------------------------------------
Two sided test
H0:m = 26.9231 - is accepted
H1:m <> 26.9231 - is rejected
------------------------------------------------------------------------------
Z = 0.0000
Zt(0.025) = 1.9600
------------------------------------------------------------------------------
These results are true with 95.000% confidence.
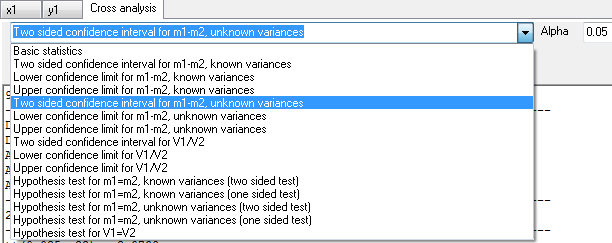
95.000%, Two sided confidence interval for
m1-m2, Variances unknown
------------------------------------------------------------------------------
Degrees of freedom n1: 10.0000
Degrees of freedom n2: 12.0000
Average 1: 33.2727
Average 2: 26.9231
Average1-Average2:6.3497
------------------------------------------------------------------------------
2.3683 <= m1-m2 <= 10.3310
------------------------------------------------------------------------------
tt(0.025, 22) = 2.0739
Sp = 21.9593