Assessment agreement analysis
Consider the following problem. Two or more appraisers make visual assessment of a given number of objects using some ratings. The question is how well subjective assessments of appraisers agree. If the appraisers assessments agree, the ratings can be considered as accurate. If the appraisers disagree, the ratings are useless.
To
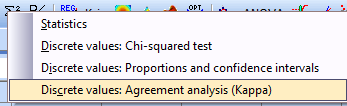
perform such analysis click Statistics icon
![]() and
select option
„Discrete variables:
Agreement analysis (Kappa)”:
and
select option
„Discrete variables:
Agreement analysis (Kappa)”:

A
statistics called Kappa (![]() ) is used to
estimate assessment agreement. It is defined as follows:
) is used to
estimate assessment agreement. It is defined as follows:

where Po is the observed proportion of coinciding assessments,
Рe
is the expected proportion of coinciding assessments.
Following
interpretation of Kappa (![]() )
is accepted:
)
is accepted:
Two versions of this problem exist. In the first version the appraisers classify each object to one of two categories called attributes (good, no good). In the second version they classify the objects according to some ordinal measurement scale (1,2,3,4,… etc.).
First version (measuring system based on attributes). In this case all objects are classified to one of two categories. In QstatLab the assessment results can be written with words or numbers, for example
ОK or NOK
Yes or Not
Good or No good
Go or No Go
Pass or Fail
1 or 0
Example 1. Two appraiser test 10 objects and provide following assessments (file: Attributes-Go-noGo.qsl):

Click
![]() . Select columns:
. Select columns:
Click „OK”. Following result is obtained:
--- INDIVIDUALLY FOR EACH APPRAISER
------------------------------------------------------------
--- ALL APPRAISERS
------------------------------------------------------------
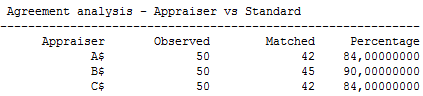
Agreement analysis between appraisers
------------------------------------------------------------
Observed Matched Percentage
10 7 70,00000000
Fleiss' kappa statistics between appraisers
------------------------------------------------------------
Cathegory Kappa Kappa-SE Z P
NOK 0,39393939 0,31622777 1,24574574 0,10642888
OK 0,39393939 0,31622777 1,24574574 0,10642888
Total 0,39393939
Ten
objects are tested, the number of coinciding appraisals is 7
(70 %),![]() =
0,3939. This shows poor assessment agreement. This example makes it possible to
study only reproducibility of assessment (whether the assessments of both
appraisers coincide). QstatLab makes possible to study also repeatability of
assessments, but in this case each appraiser should assess independently every
object at least two times.
=
0,3939. This shows poor assessment agreement. This example makes it possible to
study only reproducibility of assessment (whether the assessments of both
appraisers coincide). QstatLab makes possible to study also repeatability of
assessments, but in this case each appraiser should assess independently every
object at least two times.
Example 2. (file: Attributes-Go-noGO.qsl). Three appraisers A, B and C have made assessments of 50 parts, each of them was classified in one of two categories: Good (1) or No good (0). Each appraiser classifies each part 3 times, but he does not know that the parts are the same. The true state of these parts is known and it is denoted as “Standard”. A fragment of data is shown below.
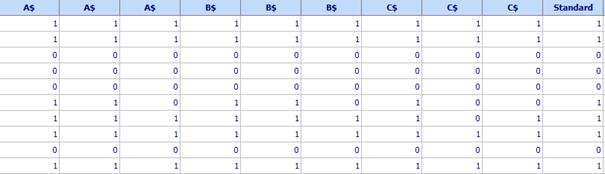
Following rules are used:
1. Data for each appraisal of a given operator (in this example: first, second, third) are recorded in separate columns.
2. The names of all columns for the same operators are the same (A$ or B$ or C$). The symbol $ means that the columns with the same names will be considered by the program as one and the same column)
3. Data for Standard are written once in a separate column.
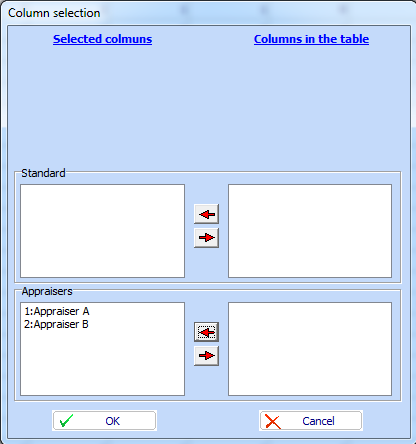
The
procedure is as follows. Click the icon
![]() and
then
and
then
![]() . Select the columns of data
as shown below:
. Select the columns of data
as shown below:
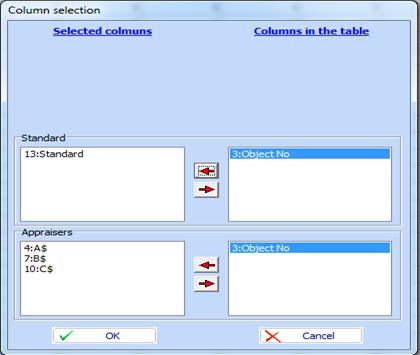
Click “OK” and the result is:
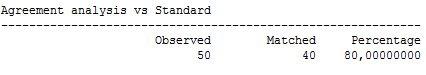
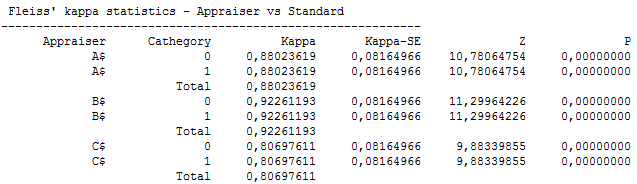
Appraiser
B has excellent agreement with Standard (![]() ).
Appraisers A (
).
Appraisers A (![]() ) and C (
) and C (![]() ) agree well with Standard. In addition
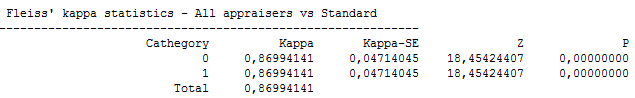
agreement of all appraisers together with Standard is very good (
) agree well with Standard. In addition
agreement of all appraisers together with Standard is very good (![]() ).
).
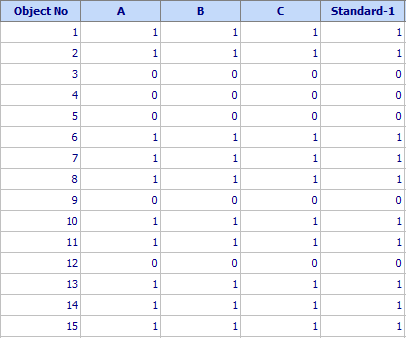
The same data can also be ordered in only one separate column for each appraiser. If there are repeated observations they should be written immediately after the first observation in the same column and it the same order. For the example under consideration there are 3х50=150 rows. Standard is repeated in the last column as many times as the number of repetitions is. A fragment of such table (15 rows of 150) is given below:
When data are ordered this way the same commands are used
to start the computation as for the first arrangement of data. However as the
repetitions are written in the same columns the total number of rows (150) is
not equal to total number of objects (50). Additional information about the
number of repetitions is needed. A key in the bottom left corner of the screen called
![]() is used to this end. Click
“Options” and a table will appear in which the operator should show the number
of repetitions for each appraiser. Then click “OK” and the same results as
above will be shown on the desktop.
is used to this end. Click
“Options” and a table will appear in which the operator should show the number
of repetitions for each appraiser. Then click “OK” and the same results as
above will be shown on the desktop.
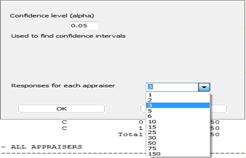
Second version (discrete data with ordered categories). When data are ranked in 3 or more ordered categories, Kappa statistics can also be used for assessment agreement. Ordered discrete data differ from attributes because in this case the ordering is important. For example if students can get marks 2,3,4,5 and 6 it is accepted that 3 is more than 2; 4 is more than 2 and 3; 5 is more than 2,3,4; and 6 is more than 2,3,4 and 5.
Example. Let 5 experts: Spas, Milka, Hristo, Dimo and Elena visually assess quality of some parts. Suppose we want to see if different appraisers assess the parts in one and the same way. Quality of parts is assessed as follows:
· Bad = 2
· Acceptable = 3
· Good = 4
· Very good = 5
· Excellent = 6
Each expert makes assessment of each part only once. Data is given in the file
MSA-Attributes-Multiple categories.qsl. They are ordered as shown below. On the same figure a table for activation of the program is also shown:
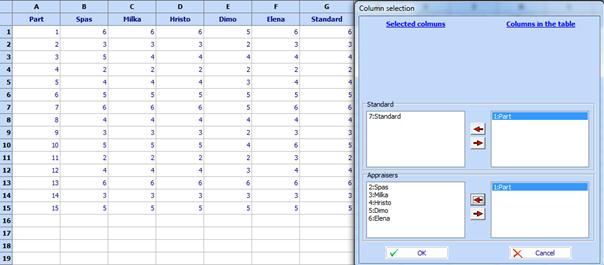
Click “OK” and following results of computation will be obtained:
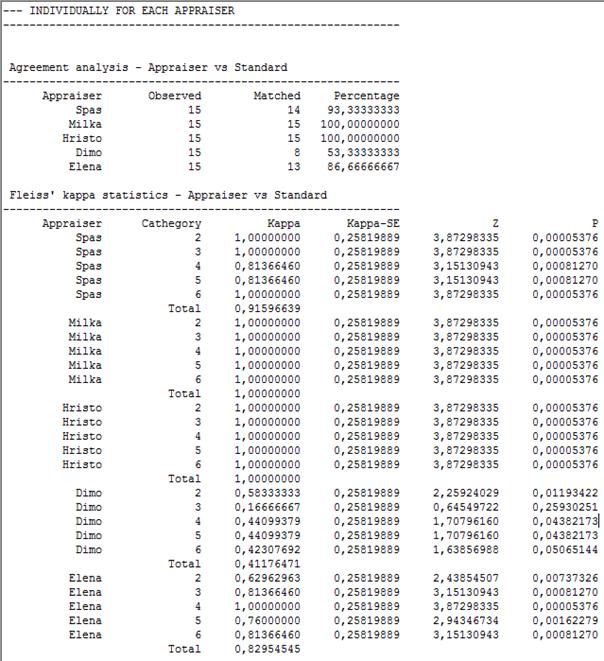
Best coincidence with Standard show the marks given by
Milka and Hristo
(100 %),
followed
by Spas
(93.3 %),
Elena
(86.7 %),
Dimo (53.3 %).
The
marks given by Milka and Hristo fully coincide with Standard
(![]() ),
coincidence of Spas’ marks is
between excellent and very good (
),
coincidence of Spas’ marks is
between excellent and very good (![]() ), it is good for Elena
(
), it is good for Elena
(![]() ), and
is not enough good (
), and
is not enough good (![]() ) for Dimo.
) for Dimo.
The results of calculations give also following information for all appraisers considered together:
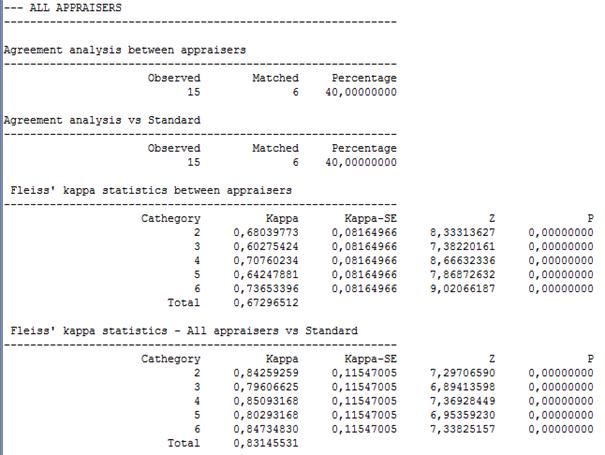
There
is not good agreement between all appraisers (![]() ).
Differences between appraisers are largest for mark 3 (
).
Differences between appraisers are largest for mark 3 (![]() ). The agreement of all marks
with the Standard is good (
). The agreement of all marks
with the Standard is good (![]() ).
).